Candlestick Patterns Explained
In terms of deriving trading signals for the binary options market, it is possible to use certain tools available in the forex and commodity markets to assist in this regard. One of the tools that can be used in this regard is candlesticks. Candlesticks are very important because they tell the trader about the behaviour of buyers and sellers in the market, and so certain patterns that they form can be used to predict price behaviour. Unlike real money gambling where all that matters is chance, in the binary options market it is all about trading price behaviour.
Candlesticks can be classified as continuation or reversal candlesticks, though the reversal candlestick patterns are the most important for use. The reversal candlesticks can be classified into bullish and bearish reversal candlesticks.
The essence of using candlesticks is to indicate what the behaviour of the asset will be in order to trade binary options contracts that can be used to mirror these price patterns.
Bullish Reversal Candlesticks
There are several bullish reversal candlesticks to choose from. In this piece, we will select just the common ones that the trader will encounter in the market. These ones are as follows:
Bullish Harami
The composition of a bullish harami is that of a bearish candlestick which is usually long, and
then a very short bullish candlestick with very tiny shadows.
The shorter candle is located more towards the centre of the preceding longer candle, giving the two-candlestick pattern the appearance of a pregnant candlestick. Harami means “pregnant” in Japanese, and this is how the candle got its name.
Bullish Engulfing
A bullish engulfing candlestick pattern is a double candlestick reversal pattern which has a small bearish candlestick with short shadows, followed by a bullish candlestick that is long, and with a higher high and lower low than the preceding bearish candle.
In other words, the second candlestick “engulfs” the first one, and the candle that does the engulfing is what the pattern is named after.
Hammer
The hammer has a short body, a long lower shadow and no upper shadow, making the pattern resemble a hammer. The colour of the candle may be bullish or bearish, but the effect is always the same: a bullish reversal at the bottom of a trend.
Inverted Hammer
The inverted hammer is simply a hammer pattern turned upside down. It is a bullish reversal pattern.
Morning Doji Star
The Morning Doji star is a triple-candlestick pattern which almost always produces a bullish reversal formation. There is a variation of this pattern called the Morning Abandoned Baby, in which the Doji gaps downwards away from the 1st and 3rd candles.
Morning Doji Star
In the Morning Doji star pattern, the 1st candle is a long bearish candle, followed by a Doji, and then a bullish candle that extends to at least 50% of the length of the 1st candle. The more this candle extends higher than 50% of the length of this candle, the more assured the reversal.
Piercing Line Pattern
This double-candlestick pattern consists of a candlestick which is bearish and long, and then a long bullish candlestick with a lower low than the 1st candlestick, but has a high that extends to the 50% mark of the 1st candle.
Bearish Reversal Candlesticks
Here are the bearish reversal candlesticks that traders will encounter very often in the forex market.
Bearish Engulfing
The bearish engulfing candlestick pattern is has as its constituent candles, a short bullish candlestick with short shadows, and a long bearish candlestick with a higher high and lower low than the 1st candle so that it “engulfs” that candle.
It is most important when it occurs at the top of an uptrend.
Harami
A bearish harami has a long bullish candlestick with a higher high and lower low than the the next candlestick which is a short bearish candlestick. Again, this paints a picture of a pregnant candlestick.
Hanging Man
The hanging man looks like a hammer, but this occurs at the top of an uptrend.
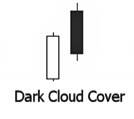
Dark Cloud Cover
This is a pattern that is the opposite of the piercing line because it resembles a piercing line pattern that has been turned upside down.
Shooting Star
A shooting star is an inverted hammer that has been turned upside down.
These are some of the commonest candlesticks that traders will encounter in the market. But the question is not just about cramming them for knowledge sake, but for knowing how to apply them in the binary options market. This is what we will discuss subsequently.
Trading Binary Options with Candlesticks
The following trade types can be handled in the binary options market using candlestick information to do the magic.
a) High/Low
Majority of the trades in the binary options market border on these two contracts, so traders may not need to bother about other contract types.
Traders have to remember that reversal candles are only good for use when they occur at the top or bottom of a trend. If they occur midway, they cannot be used as the signal will not be a genuine one.
For example, the following trade setup is good for use in trading the High/Low and Touch options contracts:
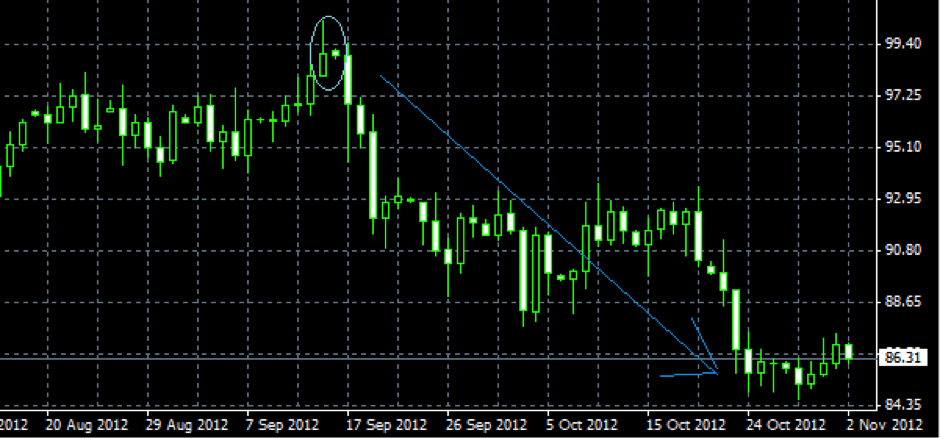
This is a bearish harami pattern. When you see one, the price action is certain to drop and this can be used for the LOW contract. This was taken from a one hour chart, so the expiry has to be a minimum of 24 hours.
Of course if the asset will head to the opposite direction, you can set a TOUCH strike price in the direction of the reversal, using at least 7 days as the expiry. The moment the price touches the strike price, the trade will be recorded as a winner irrespective of how much time is left on the trade.
You can also use a NO TOUCH trade using a strike price set in the direction opposite that of the price reversal. For this trade, use a shorter expiry in the region of 2 days.
Tagged with: binary options candlestick patterns • candlestick patterns • how to read charts


